Top 7 best candlestick analysis patterns that define an uptrend
- George Solotarov
- Hits: 638

Below we have selected for you the best candlestick patterns that define an uptrend. They are relatively easy to see and most of them have a clear signal interpretation.
Rising Triangle
One of the strongest patterns confirms the continuation of an uptrend. Its signs:
- It forms at moments of abnormal volatility, showing that a chaotic price movement is turning into a trend.
- Signs of formation: the upper line is based on the extrema and looks like a horizontal line, it acts as a resistance level. The downside is based on rising lows and acts as a support level. The price is moving inside the triangle.
- The trend continuation signal is the appearance of a long candle or a series of regular candles, which break the resistance level (the upper line of the triangle) upwards.
The pattern is formed relatively rarely and does not always have clear boundaries. When the price moves inside the triangle, a slight exit of candlesticks outside its limits is allowed.
Example.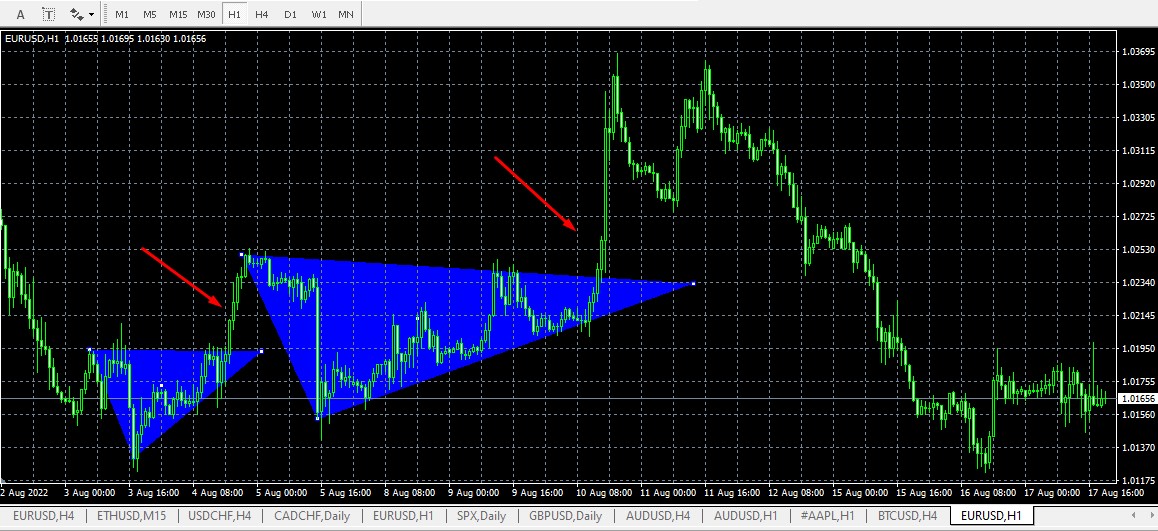
Note: both triangles start with abnormally long downward candles. Then there is an upward oscillatory movement with a gradual reduction of the candle body. And at some point, a breakthrough comes with several ascending candles in a row with an increase in their bodies. The red arrows show the candlesticks suitable for opening trades.
A bullish pennant
The pattern is similar to a "triangle" in the principle of formation. Its signs:
- It is formed on an uptrend. Its components: are a flagpole and pennant. The flagpole is a "handle", which is several consecutive rising candles. A pennant is a "triangle", but unlike the previous pattern, the resistance level is not necessarily horizontal.
- It indicates a temporary consolidation. The price going up temporarily changes into a sideways pattern. The upper extremums of the side channel form resistance and the lower extremums form support. An additional strong sign is that the bodies of the candlesticks that form a sideways channel are gradually decreasing.
- The signal of trend continuation is a breakdown of the resistance level.
After the consolidation, it is also possible to break down support. In this case, the essence of the pattern is violated - it does not turn out to be bullish. But any breakdown of the price of the triangle upwards or downwards is a signal to open a deal.
Example.
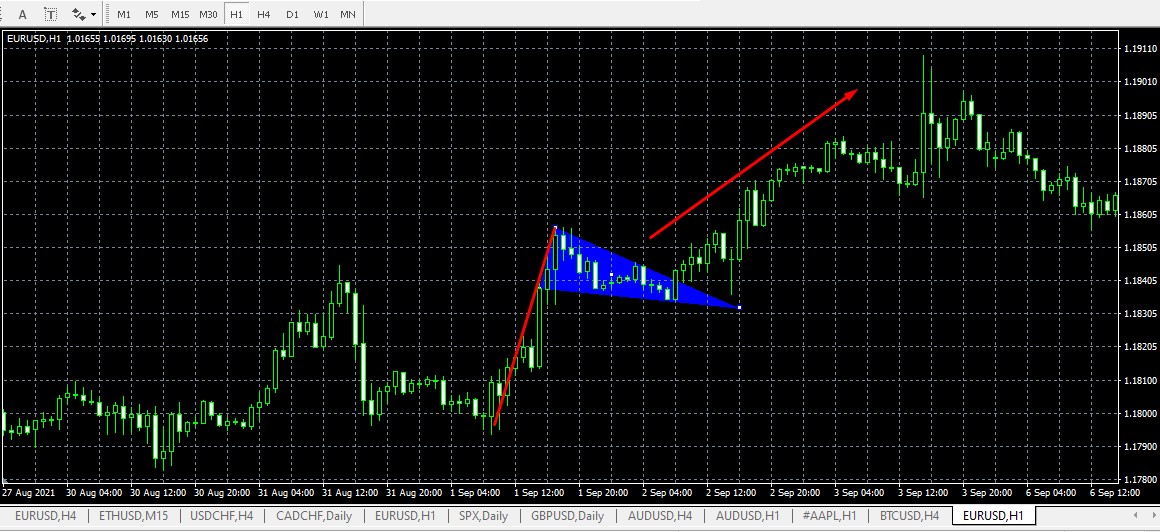
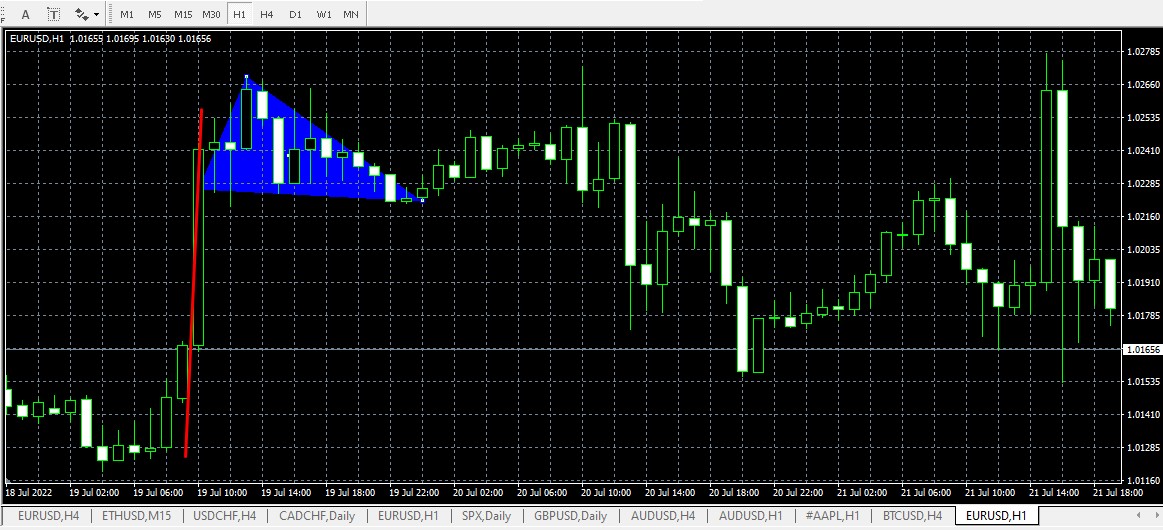
Note: In this pattern, it is important that the "triangle" is pointing downwards and that its base is "pressed" against the flagpole. For example, below is an example of an incorrect flag pattern: the "triangle" is not pressed to the base, and there are few candles without clear extrema.
Example of an unsuccessful pattern "Pennant"
Bullish flag
A pattern similar to the pennant, differing only in that a "rectangle" is formed instead of a "triangle". It should also have a downward slope.
Example.
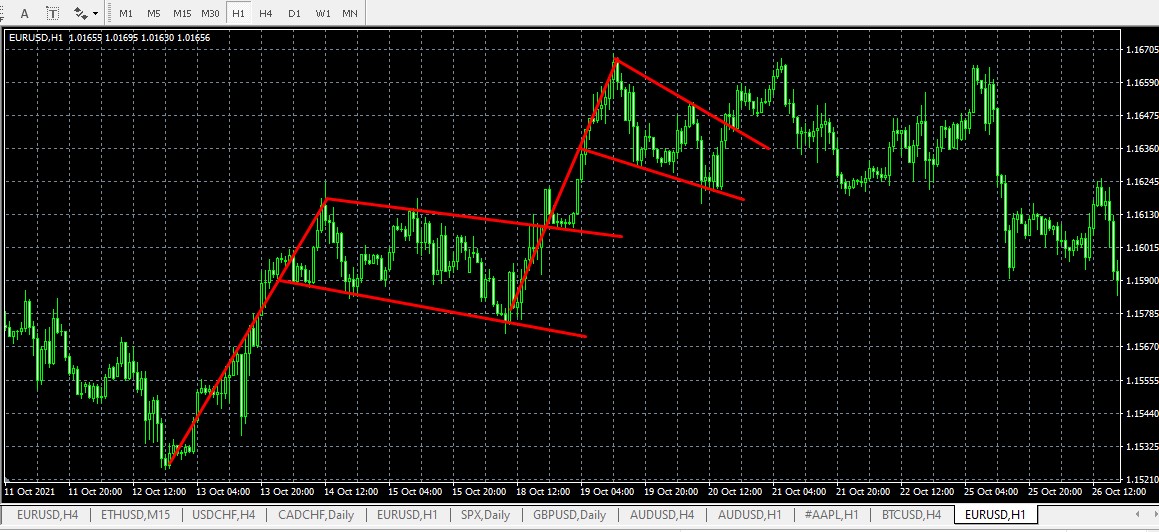
In the real market, patterns are very rarely formed perfectly, so they do not always give effective signals. Just as it is impossible to build clear triangles or draw parallel channel lines. On this chart, we have formed two relatively similar patterns to the flag. The first one is stronger as its top line has turned from resistance to support. The price broke through it, came back, and pushed back, definitively marking the continuation of the uptrend.
Morning Star.
A bullish pattern that is also a reversal pattern. Its signs:
- It forms at the end of a downtrend.
- It consists of three candlesticks. The first candle may be either bullish or bearish. The second candlestick is also any kind of candlestick, but it must have a small body. A strong signal is a Doji candle with a large downward shadow. It shows that the sellers tried to sell the price down, but by the end of the interval the price returned to its initial level. The third candlestick is bullish.
- The signal to open a deal is the appearance of the next rising candle after the pattern.
Example.
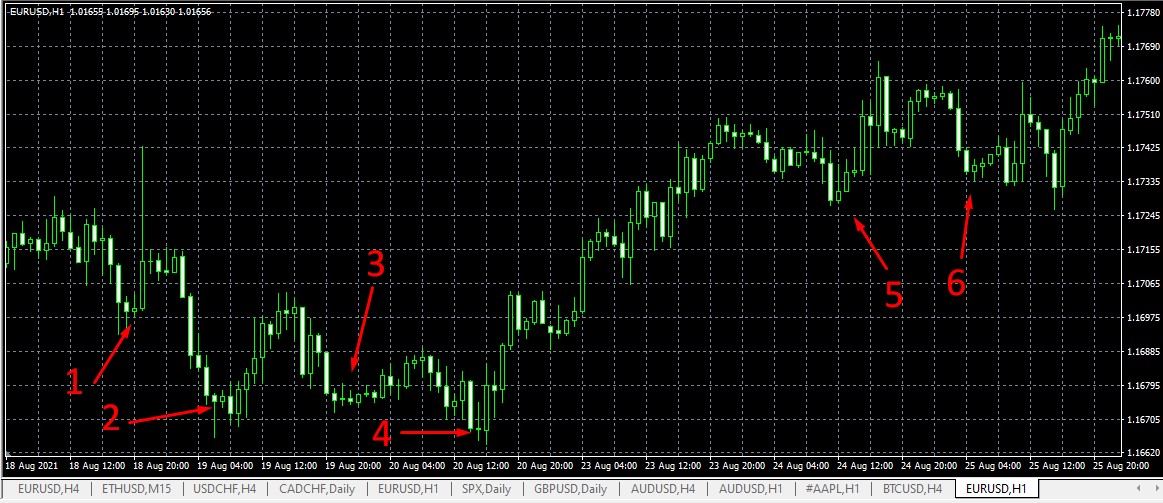
Signals "1", "2", "3", "6" are weak - there is no complete formation of the pattern. Both side candles should be much larger than the central candle. According to this principle, the pattern "4" is formed correctly and the pattern "5" is formed relatively correctly. Reinforcing signal - the long shadow of the central candle down.
Three white soldiers.
"White soldiers" call this pattern for the default white color of the rising candles on most platforms. A reversal candlestick formation indicates the end of a downtrend or the emergence of an uptrend after a flat. It is represented by three consecutive rising candles. Additional reinforcing signals:
- The body of each successive candle is larger than the previous candle. This indicates that the buyers' strength is increasing.
- Bullish candlesticks have practically no shadows.
- You see a combination of patterns on the chart: Triple-overshooting candlesticks are preceded by a pin bar, Doji or morning star.
Example.
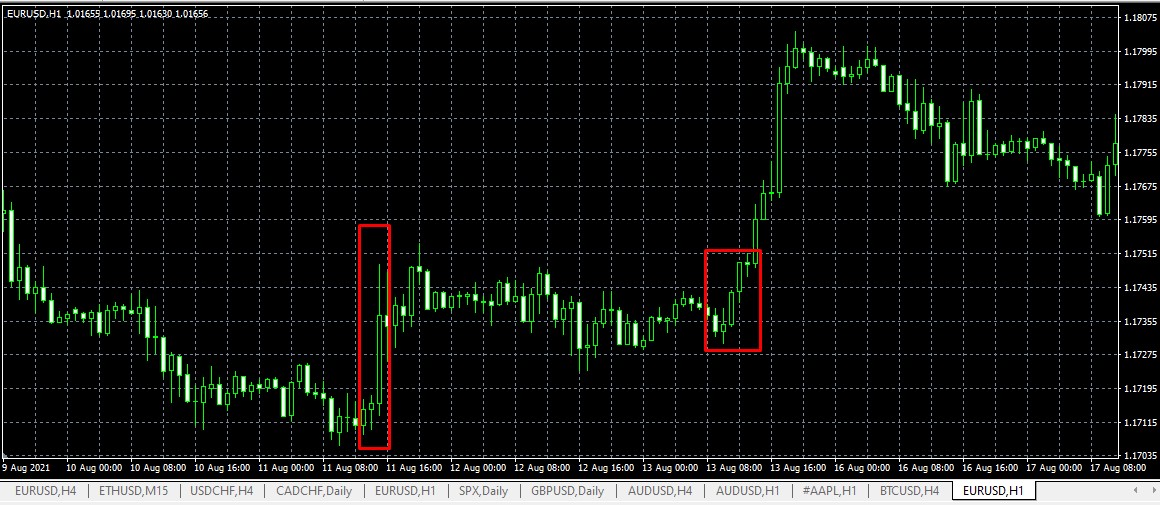
In the first case, the pattern is weak because of the abnormally different sizes of the candlestick bodies. But then the price goes sideways and a perfect "three soldiers" are formed (in MT4 the bullish candles are transparent by default): the second candle is bigger than the first, the third one is bigger than the second, and the candles have almost no shadows.
Bullish Engulfing Pattern
Bullish Engulfing Pattern of the reversal category. It is based on the idea of a bearish trend fading. The lower the price, the less willing to sell the asset - therefore the bearish candlesticks are getting smaller and smaller. But the number of buyers interested in the low price of the asset increases. The turning point will be the appearance of a bullish candle, the body of which completely overlaps the previous bearish candle.
Example.
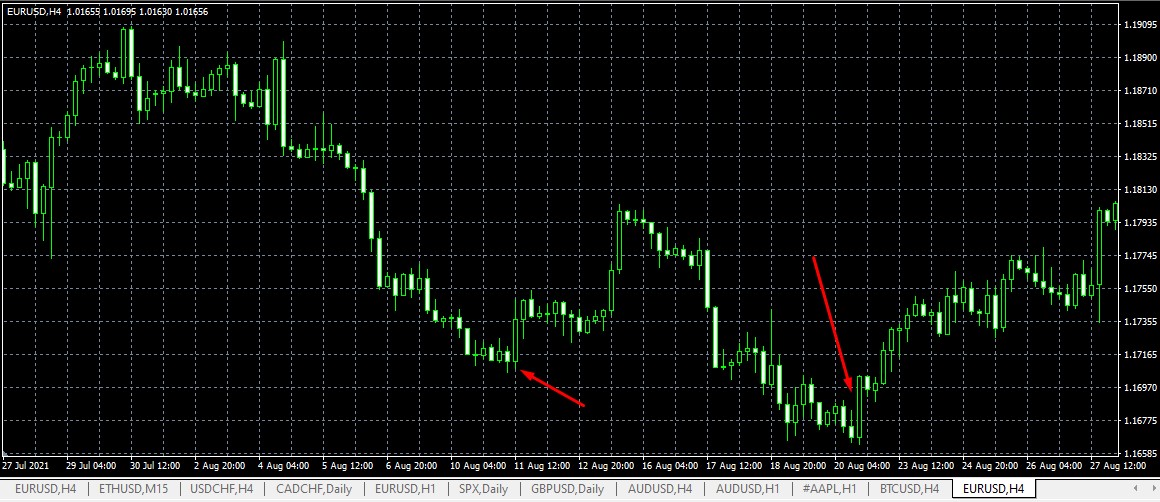
In the first case, the downward movement shows a decrease in the body of a bearish candle, followed by the appearance of a large upward candle. In the second case, there is no obvious decrease in the body of the descending candlesticks, but the pattern also gives a correct signal for an uptrend.
Hammer
The hammer is a candlestick formation that almost completely repeats the idea of a pin bar. It is a variant of the bullish reversal pattern, the main element of which is a candle with a long shadow down on a bearish trend. The shadow must be at least twice the body of the candle. Reinforcing signals:
- The body of the candle is small. It means that the price was going down under the pressure of sales volumes, but the buyers' bids were enough to balance the supply.
- Growth in volumes. Indicates that the market is recovering and shows that the price reversal is justified.
- The signal candlestick is ascending. It means that buyers have not only satisfied the supply but also created additional demand by raising the price.
Additional signal: behind the signal candlestick there is also an ascending candlestick, and the pattern "Hammer" gradually turns into "Three white soldiers".
Example.
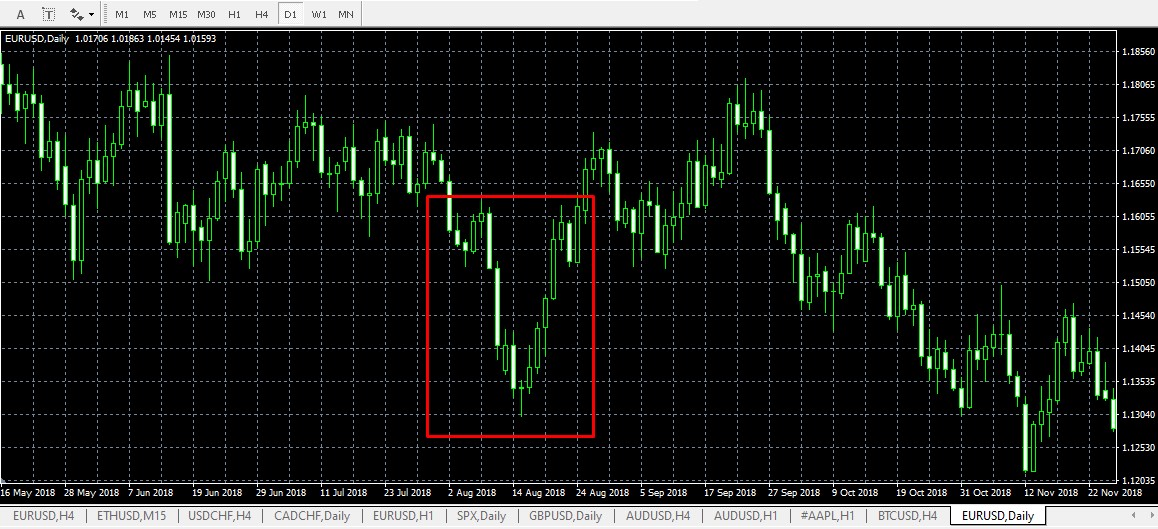
The pattern is formed only in the trend markets. On the chart you can see a strong downward movement which breaks off with a pin bar - the initiative is ready to be taken by the buyers. After the pin bar, which is a "hammer" in this case, there are three consecutive ascending candles with increasing bodies - the pattern "Three white soldiers".
In the following very useful article on this subject, you can learn the main tips on how to use patterns
___________
Also, if you want to use all available trading tools to increase your profits as soon as possible - follow this link below, or contact us via live chat. Our experts will help you to choose the best strategy for success.
Follow our updates for useful information in our series of articles. You can also visit our previous article to better understand this topic.

