The stages of constructing supply and demand zones:
- George Solotarov
- Hits: 387
The demand zone is the zone where there is an imbalance towards buyers - it is formed at the bottom after a downtrend. The supply zone is formed at the top of the chart on an uptrend.
There are no unified rules for marking the supply/demand zones. Most sources indicate the range, in which the trend has been unfolding for some time - the zones are at the end of an uptrend or downtrend. But there are also examples of the formation of intermediate zones - which can then be broken up or down.
- Determining highs and lows by analogy with the rules for constructing key levels.
- Determination of the boundary of a probable zone by the furthest extrema and near extrema. Near extrema are earlier extrema and far extrema are later extrema.
- Searching for both demand and supply zones on the same chart simultaneously.
1 - Formation of the demand zone

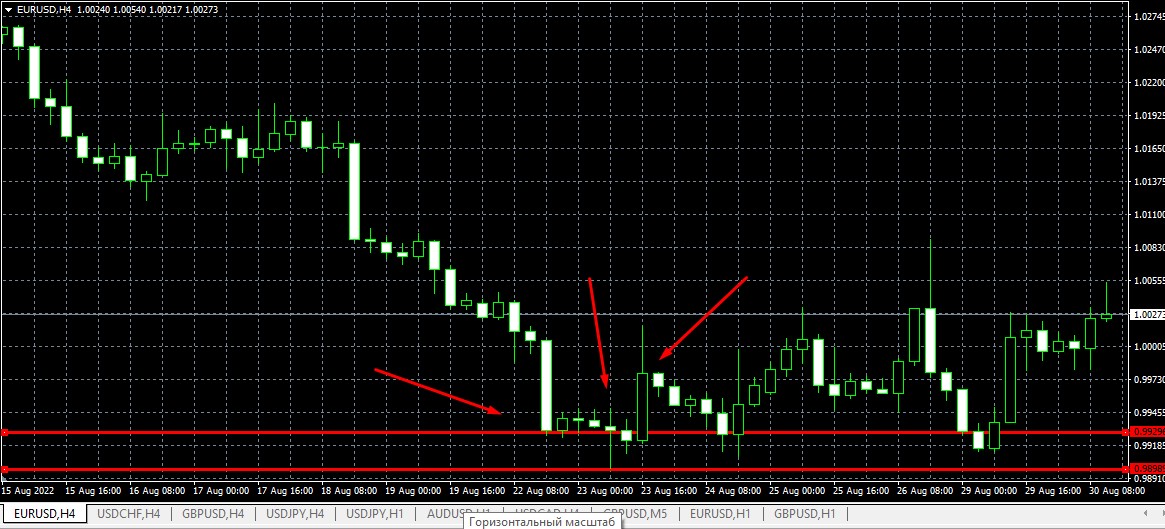
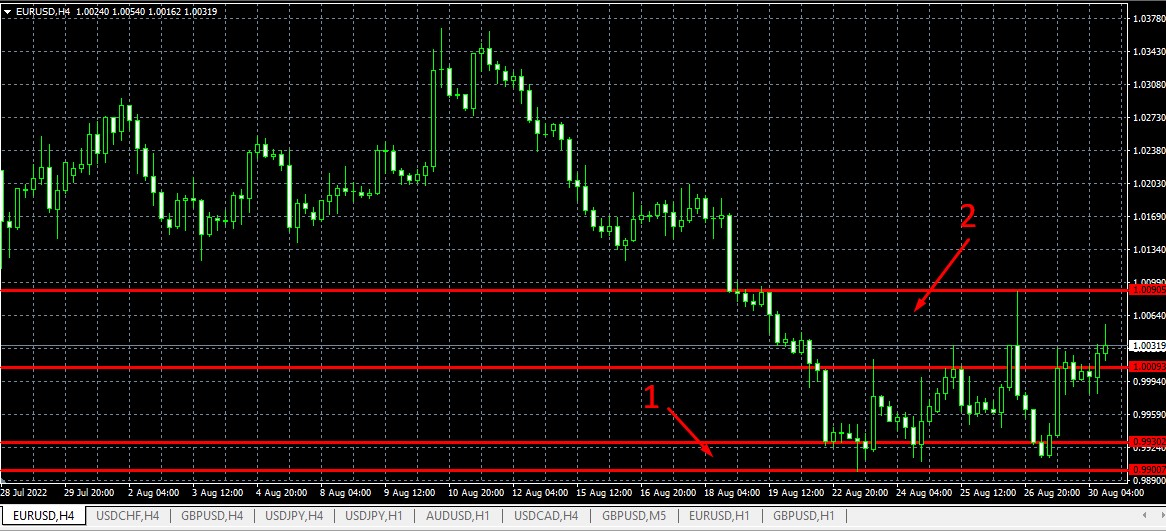
Here the demand zone is formed by the first three candlesticks that have drawn a strong support level - the line near extrema (the first horizontal line downwards). The line of far extrema is drawn at one point - the shadow. The resulting zone is a demand zone.
The price has reversed several times in the demand zone and goes upward at the moment. We try to build the supply zone: we zoom out and look for the boundaries of the possible supply zone.
2 - Formation of the supply zone

The far extremum of the offer area (the uppermost line) is built using the level of the previous short-term consolidation and the shadow. The lower level is based on the extrema of the current flat movement. The offer zone itself is marked with the number "2". It is quite possible that the price after entering the supply zone will break through its upper (far) level and continue the upward movement. Then it will be necessary to decrease the scale and look for a new probable zone.
Please note that in the screenshot, the range between the supply and demand zones has formed a flat area within which price has been moving, periodically breaking through it now and then into the "1" and "2" zones. But because these are zones of excess demand and supply, trading volumes brought the price back to the flat.
The reason for the formation of zones is the installation of pending orders. Example of a demand zone:
- In the demand zone, sellers' take-profits are set. Take Profits are pending orders to buy an asset (close short positions). Accordingly, massive purchases turn the price up. Every trader has their own principle of taking profit: some traders set it at the support level, some - a bit higher, and some - waiting for the patterns. The heterogeneity of levels forms a zone where local extremums are formed, as in the chart above.
- Buyers' stops are set in the demand zone. Buyers are betting on the growth of the trend, but sellers are pushing the price down. At the support level, buyers' stops are triggered - orders to sell the asset. And the price goes even lower. At some moment most buyers agree with the current price and use their buying volumes to turn the price up. Buyers' stops also form a zone of accumulation of the largest volumes capable of turning the price up from the near border of the zone or selling the price further down to the far border of the zone.
Another reason for the formation of zones is the placing of large limit orders. For a bidding zone, these are sell orders. Large market makers can't place large volumes to sell without affecting the price decrease. That's why they look for zones of mass accumulation of orders to buy small traders. As soon as the price reaches the beginning of the demand zone (imbalance towards the buyers), a large order is placed, which "absorbs" the small volume and pushes the price down further to the second border of the zone. When the buyers prevail again, the price returns to the upper boundary of the demand zone, where large sellers can enter the market again. Thus, there is a movement inside the zone with periodic exits of the price outside the zone. At some point, the supply (sell orders) runs out and the price moves out of the zone, breaking through the near level, and goes upward.
In the next article, we will take a closer look at the indicators for determining the borders of supply and demand zones.
___________
Also, if you want to use all available trading tools to increase your profits as soon as possible - follow this link below, or contact us via live chat. Our experts will help you to choose the best strategy for success.
Follow our updates for useful information in our series of articles.

