
Swing Trading Indicator: 3. Relative Strength Index (RSI)
- George Solotarov
- Hits: 462

To gain maximum profit a trader should timely find the moment of price reversal. To do this, oscillator indicators are used in forex trading. RSI is an impulse oscillator, which measures the relative speed and strength of price movements compared with the past performance of an asset. It is displayed as a line, which oscillates between 0 and 100.
Type of signal: Lagging;
Base set: the key triggering points for the RSI signal are the 70 and 30 levels. If the RSI line crosses above 70, we assume that price has entered "overbought" territory and a sell signal is generated. Similarly, when the RSI line crosses below 30, it is assumed that the price has moved into "oversold" territory, and a buy signal is generated.
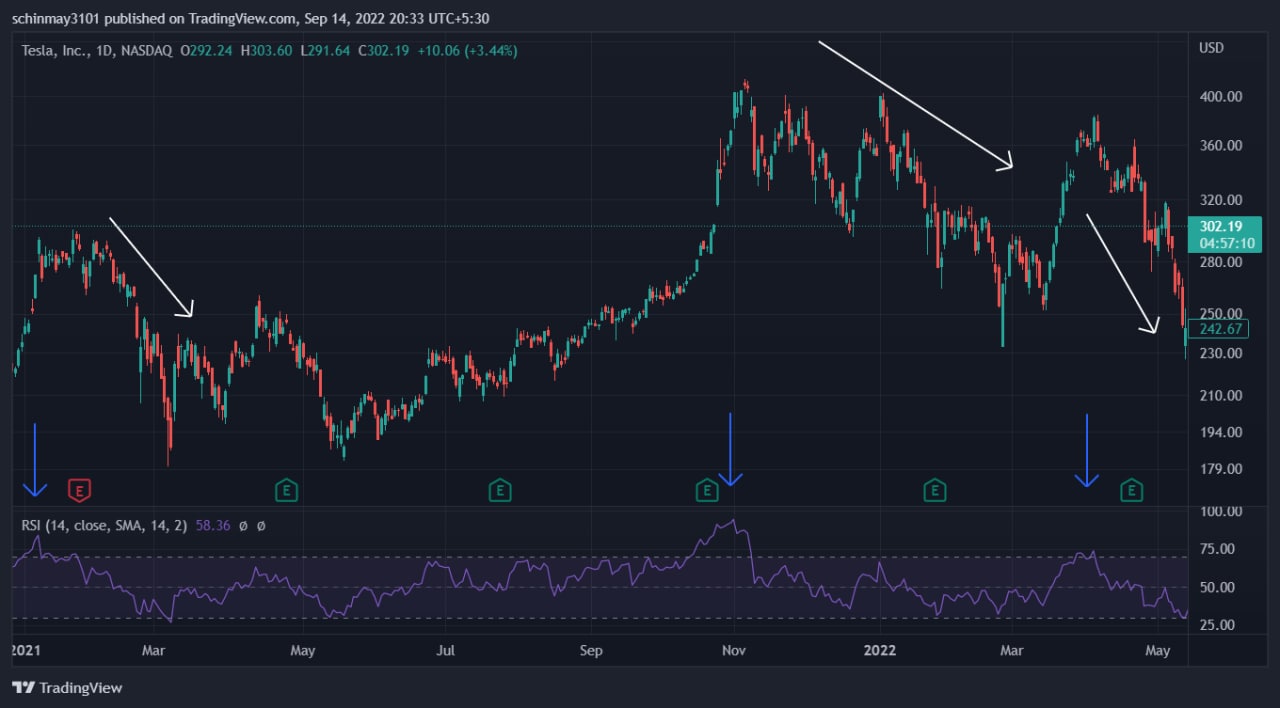
Example. In the following chart for $TSLA, we see that every time the RSI line crosses the 70 levels, the stock is undergoing a correction. This confirms the theory that RSI over 70 generates a sell signal.
Also, if you want to use all available trading tools to increase your capital as soon as possible - follow this link below, or contact us via live chat. Our experts will help you to choose the best strategy for success.