
Swing Trading Indicator: 4. moving averages convergence-divergence indicator (MACD)
- George Solotarov
- Hits: 489

A versatile Expert Advisor which combines the functions of a trend indicator and an oscillator. The MACD is an impulse indicator that forms signals by interconnecting two moving averages of an asset price with different time frames. The indicator is based on the interaction of two lines (MACD and signal line) generating a trading signal and a histogram showing the strength of the current market trend.
Signal type: Leading; Strength; Entry/Exit
The MACD is easy to use in your trading strategies, even a beginner can do it. If the MACD line (blue) crosses the signal line (red) from below, a buy signal is generated. Similarly, if the MACD line crosses the signal line from above, a sell signal is generated. The strength of each signal should be confirmed by a bar chart which shows the volume of the market and the activity of its participants.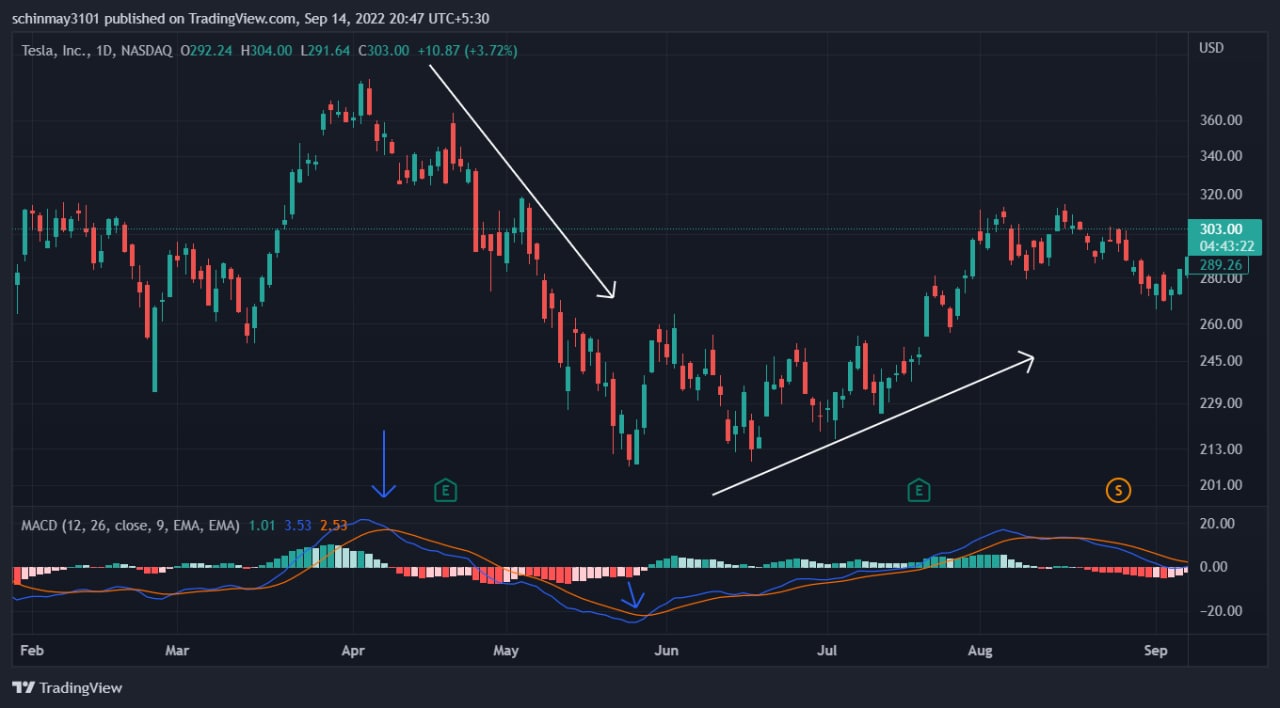
Example: The chart below for $TSLA shows that when the MACD line crosses the signal line from above, the stock is moving down. This sell signal is further confirmed by the large bars on the histogram. Similarly, when the MACD line crosses the signal line from below, the stock is moving up. This buy signal is additionally confirmed by large bars on the histogram.
Also, if you want to use all available trading tools to increase your capital as soon as possible - follow this link below, or contact us via live chat. Our experts will help you to choose the best strategy for success.