Swing Trading Indicator: 7.Fibonacci Retracement
- George Solotarov
- Hits: 462

When analyzing the price chart it is noticeable that the quotes change within a certain range. When certain values are reached, the price seems to bounce up or down. The Fibonacci retracement tool is a popular technical indicator that can be used to identify key support and resistance levels. This information helps to determine market entry points and competently place takes profit and stops loss orders. The indicator is based on the Fibonacci numbers sequence invented by Leonardo Pisano. The Expert Advisor works best during a trend market movement, using these lines you can build forecasts of price reaching certain levels, as well as corrective deviations.
Signal type: Leading; Entry/Exit
Base set: In an uptrend, the indicator generates a buy signal when the price rebounds from Fibonacci support levels. On a falling market, a sell signal is generated when the price rebounds from the Fibonacci resistance level.
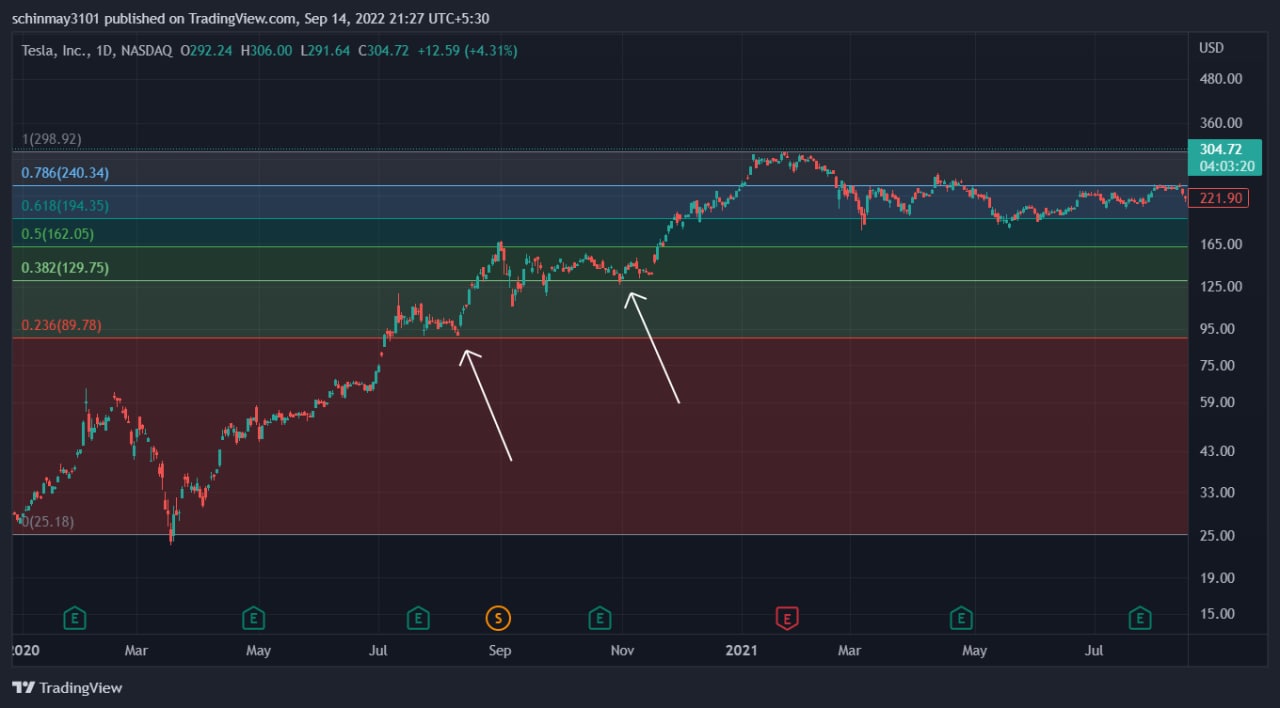
Example. The following chart for $TSLA shows that the price of the asset is rising, but periodically returns to various Fibonacci levels. As soon as the price lows reach support levels, the quotes start moving up again, confirming the buy signal.
Also, if you want to use all available trading tools to increase your capital as soon as possible - follow this link below, or contact us via live chat. Our experts will help you to choose the best strategy for success.

