How to Read Bollinger Bands Indicator Signals? Tips for beginners
- George Solotarov
- Hits: 424

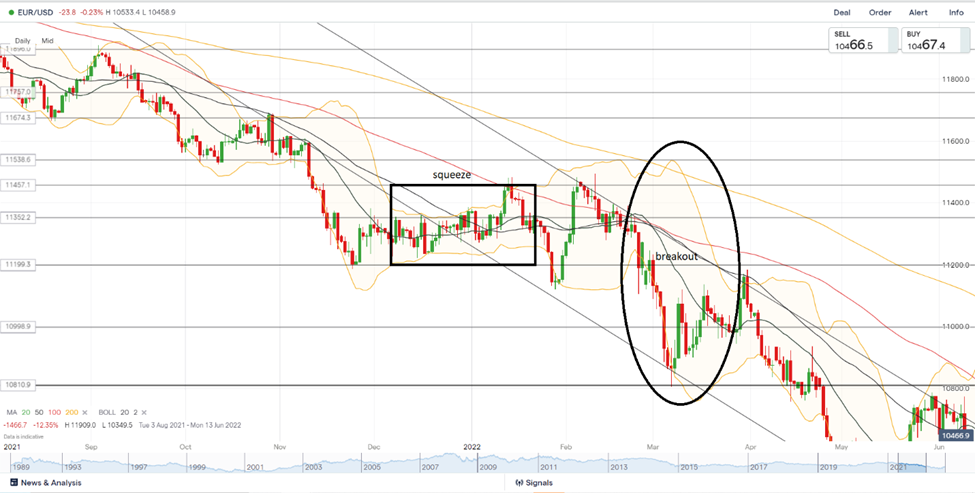
One of the main signals to prepare for entering the market is the compression of the Bollinger Bands. In the chart below we can see how the EURUSD pair entered a consolidation phase, which was accompanied by a squeeze of the upper and lower bands. After a false breakthrough support, the euro eventually broke through it and continued falling, which, in its turn, was accompanied by the widening of the bands and a decrease of the lower one.
Thus a trader has received two signals: the first one - is band compression, which is a precursor of either support or resistance breakdown, unfortunately, Bollinger Bands does not predict the direction; the second one - is expansion, which in general may be regarded as a confirmation of the breakdown.
How to install and configure the Bollinger Bands indicator?
As mentioned earlier, the Bollinger Bands indicator uses a moving average with a period of 20, regardless of the type of trading - intraday or long-term. However, professional traders can change the settings based on their own preferences and experience, so there is no single standard here. In short-term trading, you can use MA with a smaller period, and in the long-term - with a larger period.
Also, if you want to use all available trading tools to increase your capital as soon as possible - follow this link below, or contact us via live chat. Our experts will help you to choose the best strategy for success.

