
What is a triangle pattern in trading?
- George Solotarov
- Hits: 435
The "behavior" of an instrument's price directly depends on the actions of market participants. Thus, when most traders buy - the price goes up, when they sell - the price goes down, and when both sides put in more or less the same effort - the price consolidates. As the instrument consolidates, a corresponding pattern is formed, and here we will look at one of the most frequently formed patterns, which is called the "triangle" pattern.
After reaching a strong bearish resistance in an uptrend, the price starts oscillating between resistance and support, which is the area where the instrument continues to be actively bought. Eventually, the price oscillations start to fade, tapering to the middle (tops are lower and bottoms are higher), and then a triangle pattern is formed, which can be clearly seen when drawing two lines - one on the declining tops and another on the rising bottoms. Similarly, it is formed in a downtrend.
The waning of the price chart fluctuations reflects a decrease in volatility, which usually precedes a price breakout in one direction or the other, and the instrument continues either rising or falling. Unfortunately, the pattern of a triangle is not an explicit continuation or trend reversal, but if it is formed within an active pronounced trend, there is a very high probability that a breakout and exit from the formed range will take place in the direction of the trend.
Like many figures of technical analysis, the most reliable is the formation of a triangle within a long-term trend, i.e. when the decay of price fluctuations on the background of the volatility decrease occurs within a few months. Otherwise, when the process lasts from a few days to a few weeks, some other pattern may be formed, which, however, can also be a continuation pattern or a trend reversal pattern.
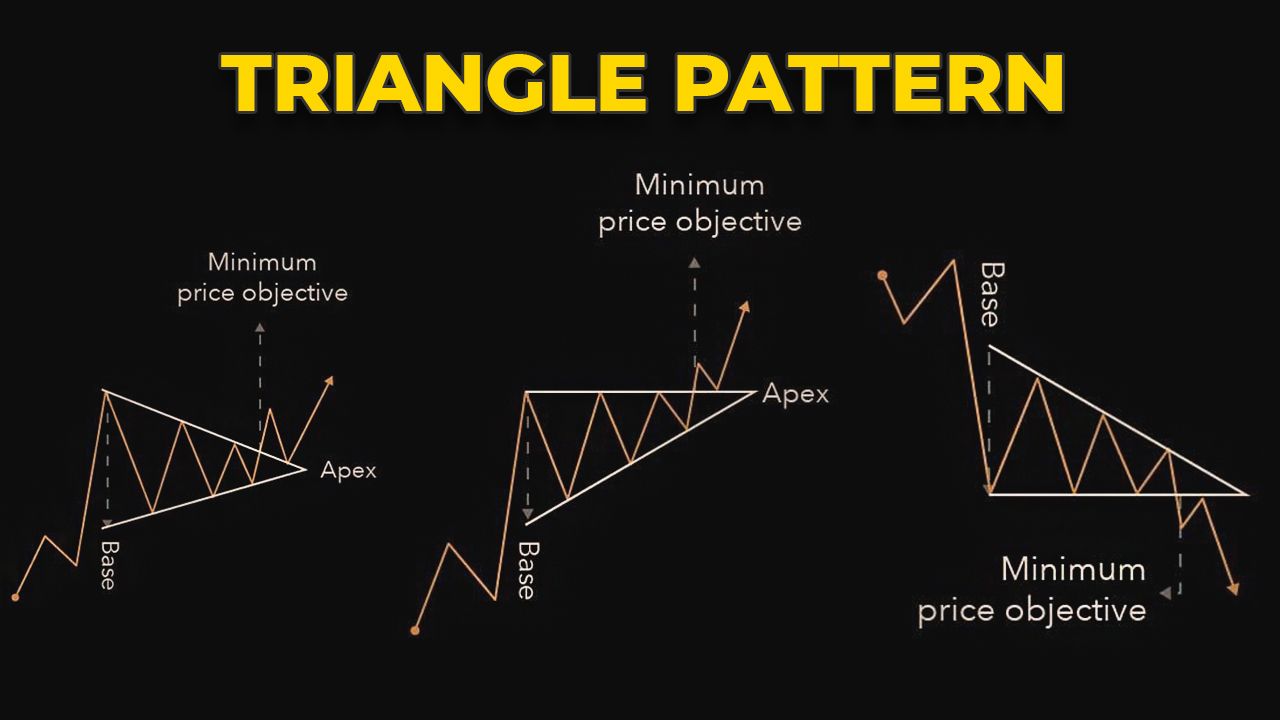
Below is a schematic representation of a triangle pattern in an uptrend (bullish) and a downtrend (bearish), both of which are trend continuation patterns: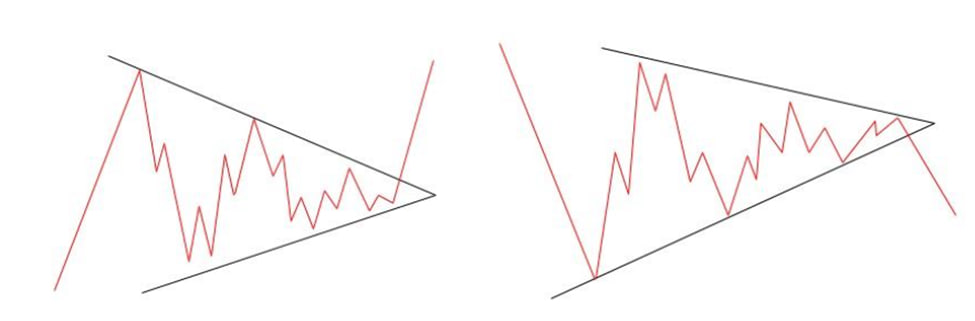
A triangle pattern is considered formed when the price has made at least five touches of support and resistance, i.e. 2 or 3 touches of support and 3 or two touches of resistance - in any of these cases it does not matter how many times which side.
We would like to point out that perfect and beautiful triangles, as shown in the schematic drawings, are "drawn" not very often. So, it's recommended for newbies not to try to find beautiful and clear pictures, to calculate the number of touches of one or another side of the triangle, etc., but to approach this question more creatively, i.e. to try to see what the market wants to say.
In the next article, we will analyze types of triangle patterns in detail.
Also, if you want to use all available trading tools to increase your capital as soon as possible - follow this link below, or contact us via live chat. Our experts will help you to choose the best strategy for success.