Types of Triangle Patterns in Trading
- George Solotarov
- Hits: 423

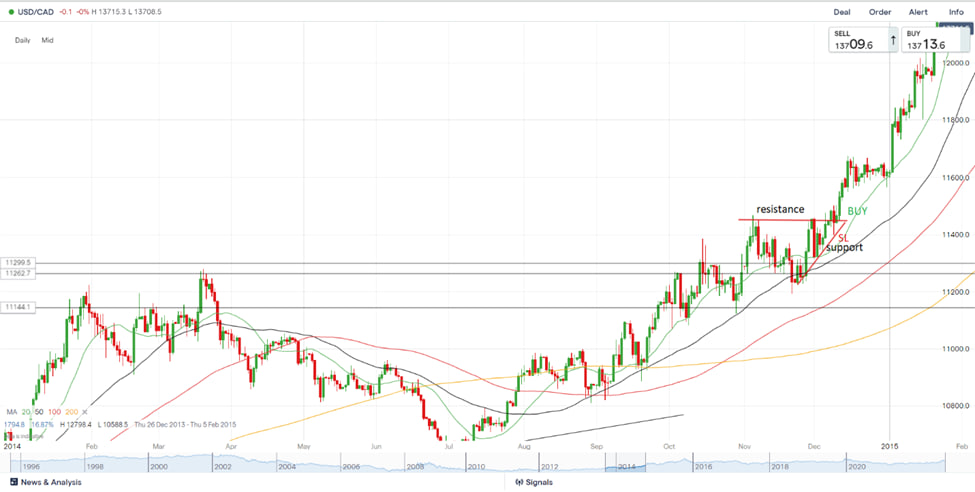
If there is a situation where there is a horizontal line of resistance and an ascending line of support drawn on the ascending lows, the triangle is called an ascending triangle.
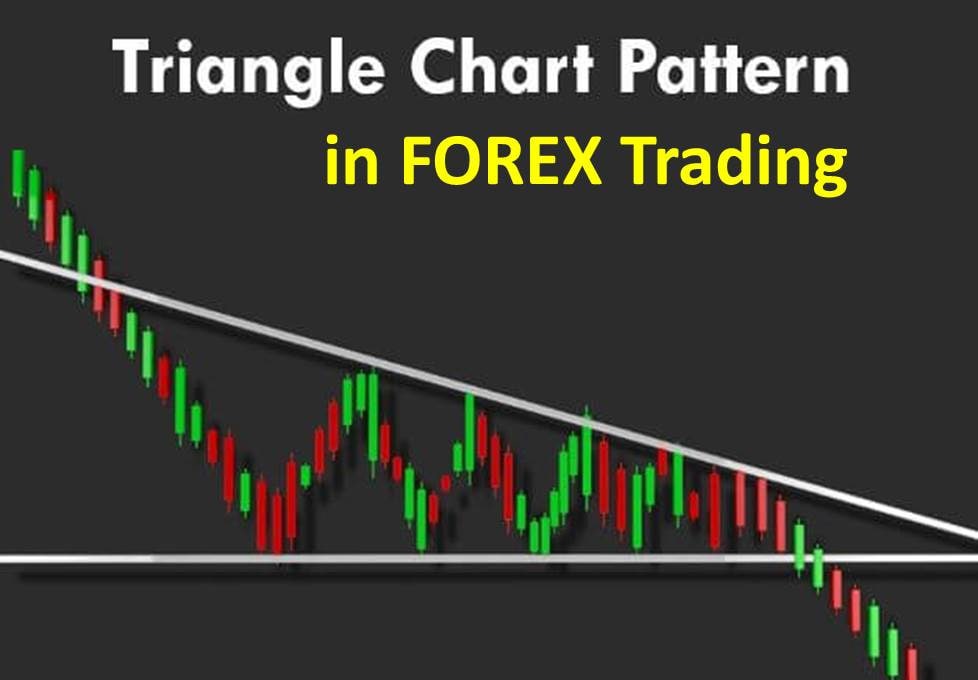
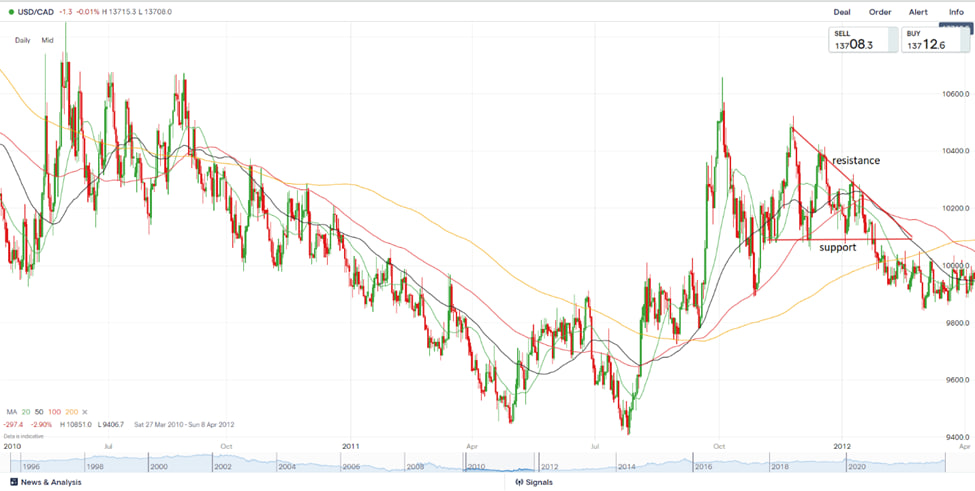
Conversely, if there is a downward resistance line drawn across the descending lows and a horizontal support line - we get a descending triangle.
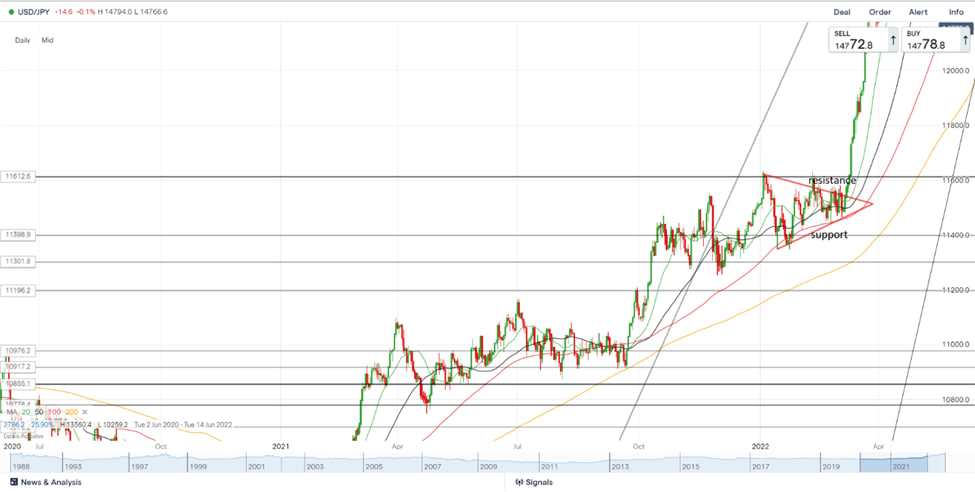
If the downward resistance line and the upward support line meet in the middle of the consolidation range when price fluctuations subside, this type of triangle is called a symmetric triangle.
An ascending triangle pattern
The rising triangle pattern reflects a situation when there is a strong demand for an instrument, which pushes the price higher and higher, but the bulls cannot yet overcome the bulls' buffer. However, the moment comes when the bulls gain enough volume to absorb their buffers, and the price gets an additional impulse against the background of protective stop-loss orders triggering and rapidly moving in the upward direction.
We can see in the example above the formation of an upward triangle in the USDCAD, where the resistance is the horizontal line, and the support is the ascending line drawn on the ascending lows. In this example, the formation of the triangle took place within the uptrend and breaking through the resistance led to a further rise in the price of the pair.
Downward Triangle Pattern

This example shows the same pair, USDCAD, and in this case, we see the formation of a Downward triangle, this time on a correction within a downtrend, followed by a breakout of the horizontal support line. The descending resistance line is drawn on the descending tops. In this case, the price did not get any significant momentum after breaking through the support.
Symmetrical triangle pattern

We can see the descending resistance line drawn on the descending tops and the ascending support line drawn on the ascending bottoms, and both lines converge almost in the middle of the range. The triangle pattern was formed as part of an uptrend where there was a resistance line breakout and continued development of the uptrend.
Also, if you want to use all available trading tools to increase your capital as soon as possible - follow this link below, or contact us via live chat. Our experts will help you to choose the best strategy for success.

