How To Trade A Triangle Pattern: Examples
- George Solotarov
- Hits: 560

The most reliable pattern for trend continuation will be an uptrend or downtrend, i.e. the formation of an uptrend triangle will give a good chance for the price to continue growing, while the formation of a downtrend triangle will give a good chance for the price to continue falling. Thus in the first case, the rising line will be a strong support, from which you can buy waiting for resistance to be broken, and in the second case, the descending line will be a strong resistance, from which you can sell waiting for support to be broken. The pattern of a symmetrical triangle may be a continuation pattern or a trend reversal pattern.
Strategies for trading using the triangle pattern
The triangle pattern is most often used to trade on a level breakout. As mentioned above, when an upward triangle is formed, an experienced trader will prepare to open a buy position after the breakdown of resistance. The most optimal point of passing resistance or breaking through support is on ½ or ¾ of the pattern path or interval. Up to ½ of the path the breakout is considered premature.
Often a pullback to the broken level is expected and a chart candle (timeframe of at least 4H) will close above this level.
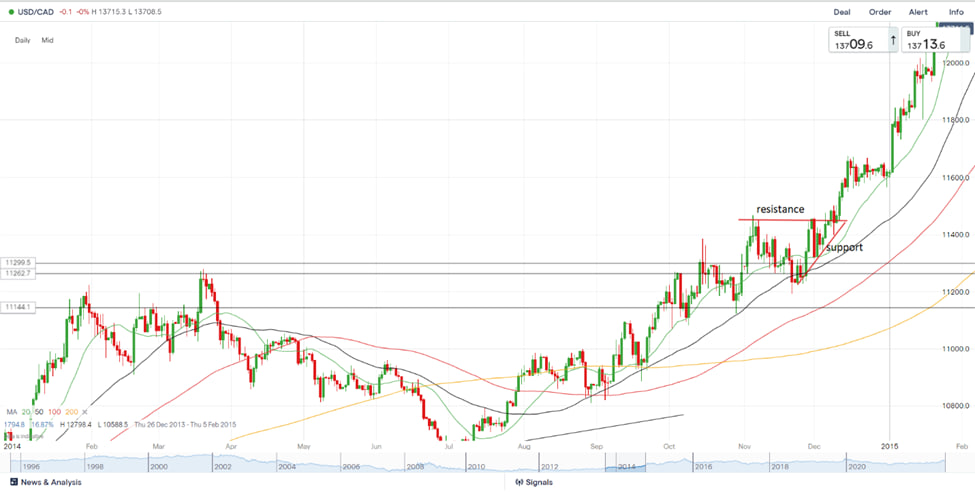
Below is an example of buying the USDCAD on a pullback after a breakout:

On the same USDCAD chart, we see the formation of an ascending triangle, break the horizontal resistance line, pullback, and buy on the pullback with a protective stop loss order below the last bottom (below the ascending support line). The pair continued to grow, and the trader gained a good profit. In such a trade, as we can see, there is a very good Risk/Reward ratio.
The minimum target is set at a distance equal to the distance from the maximum to the minimum point of the triangle. In this case, you can use the trailing stop loss order below MA20.
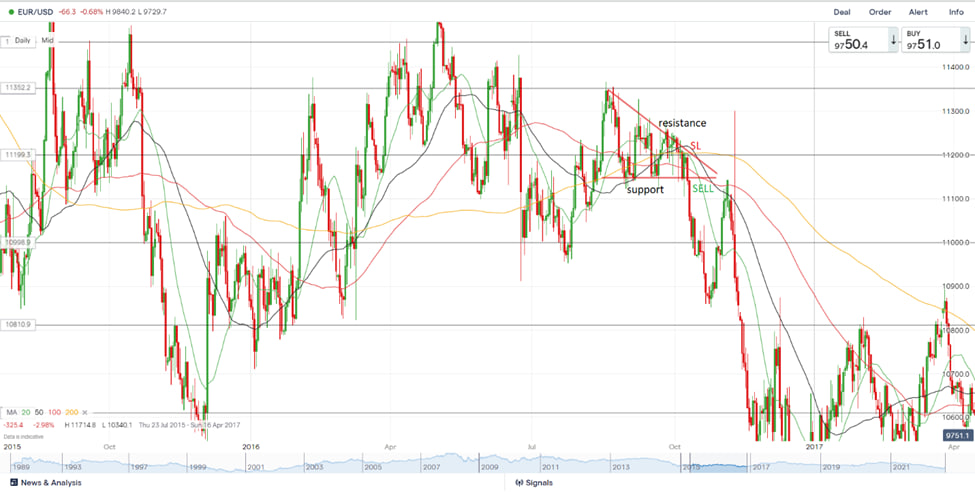
Selling when support is broken through works the same way:

On the EURUSD chart, we see the formation of a descending triangle. The pair is sold after breaking through the horizontal support line and placing a protective stop loss order above the last peak (above the descending resistance line. The minimum target is calculated according to the same principle as in the buy example above, and the trailing stop loss order can also be placed above the MA20.
Both ascending and descending triangles can be bought or sold from the ascending support line (rising triangle) or sold from the descending resistance line (descending triangle), in addition to a breakout strategy. In these cases, too, the Risk/Reward ratio is very good.
There are situations where the price keeps going up or down without rebounding to the broken resistance or support level, and the trader opens a buy or sell position after a certain time lag, that is when the price has passed a certain distance. In these cases, the trader carries much greater risks, because a protective stop-loss order will have to be placed below the broken level.
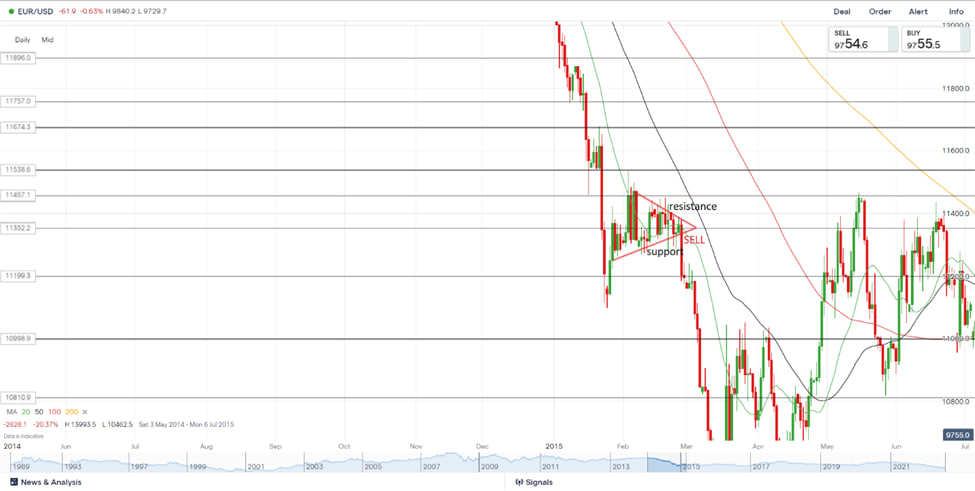
Example with a symmetrical triangle:

Here, the EURUSD price has formed a pattern of a symmetrical triangle within an active and strong downtrend. In this case, this triangle was a trend continuation pattern, where it made sense to sell at the breakdown of its lower boundary (the ascending support line) with a protective stop-loss order set above the upper boundary (the descending resistance line). The minimum profit target is set in the same way as in the examples above, and the trailing protective stop-loss order can be set above MA50.
Also, if you want to use all available trading tools to increase your capital as soon as possible - follow this link below, or contact us via live chat. Our experts will help you to choose the best strategy for success.

