How to draw a trend line correctly?
- George Solotarov
- Hits: 330

As mentioned in the previous article, the validity of the trend line should be confirmed by at least three touches of the price chart of this line. In addition, in order to determine the trend line with maximum accuracy, the trader should consider the graph both on the enlarged scale and on the reduced scale. This will allow the trader to consider the chart from different angles and avoid erroneous determination of the trend.
With a larger scale chart trader risks taking a pullback or correction as a development of the trend, which will lead to erroneous decisions and losses on open positions. To avoid this, it is necessary to examine the chart on a smaller scale and/or a larger timeframe, i.e. to see the picture "globally" rather than "locally".
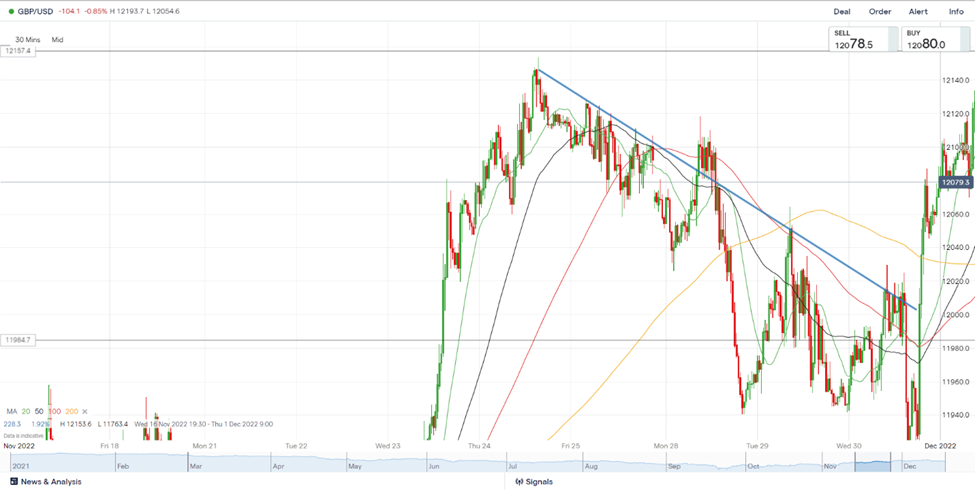
Below is an example of a "local" view of the situation:

The chart shows a pronounced downtrend, and the validity of the trend line, drawn by the upper points on the pullbacks of the GBPUSD chart, is confirmed by several touches.
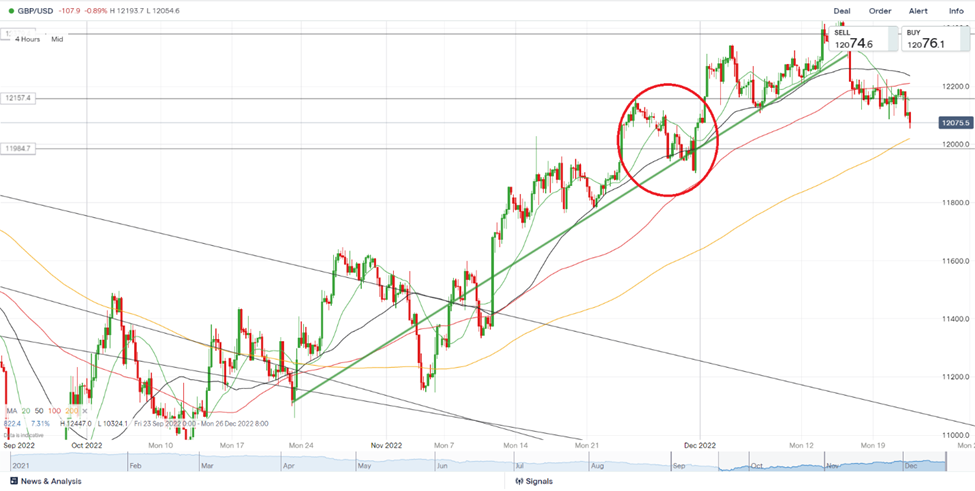
But, if we look "globally" at the 4H timeframe, we can see the following picture:

An area of the price chart that looked like a strong downtrend in the previous example is highlighted in red (30M timeframe), while in this chart just a small pullback within a large-scale uptrend. Thus, the incorrect identification of the trend can cause a wrong decision and, as a result, the losses incurred.
In this situation, by studying the 4H timeframe chart, the trader would be able to identify the long-term uptrend and, using the pullback to the uptrend line (trend line), enter the market to buy GBPUSD and get a very good profit.
Also, if you want to use all available trading tools to increase your capital as soon as possible - follow this link below, or contact us via live chat. Our experts will help you to choose the best strategy for success.

