
Technical Analysis Indicators for Swing Trading
- George Solotarov
- Hits: 461

In this series of articles, we will analyze in detail several basic indicators for swing trading.
1: A volume indicator
Volume is measured by the number of deals with an asset during a certain period. First of all, it acts as a tool for confirmation of price action breakthroughs. Exactly in the periods of high activity of buyers and sellers, the strongest price movements are observed on the market.
Signal type: Coinciding; confirming
Basic setting: Higher volume represents greater strength of the market direction in which an asset is being tracked. Thus, if a breakout occurs with high volume, the asset is expected to support it and go up. High sellers' activity can signal a bear market and a continuation of the downward trend of the asset's quotations after the breakout of key levels.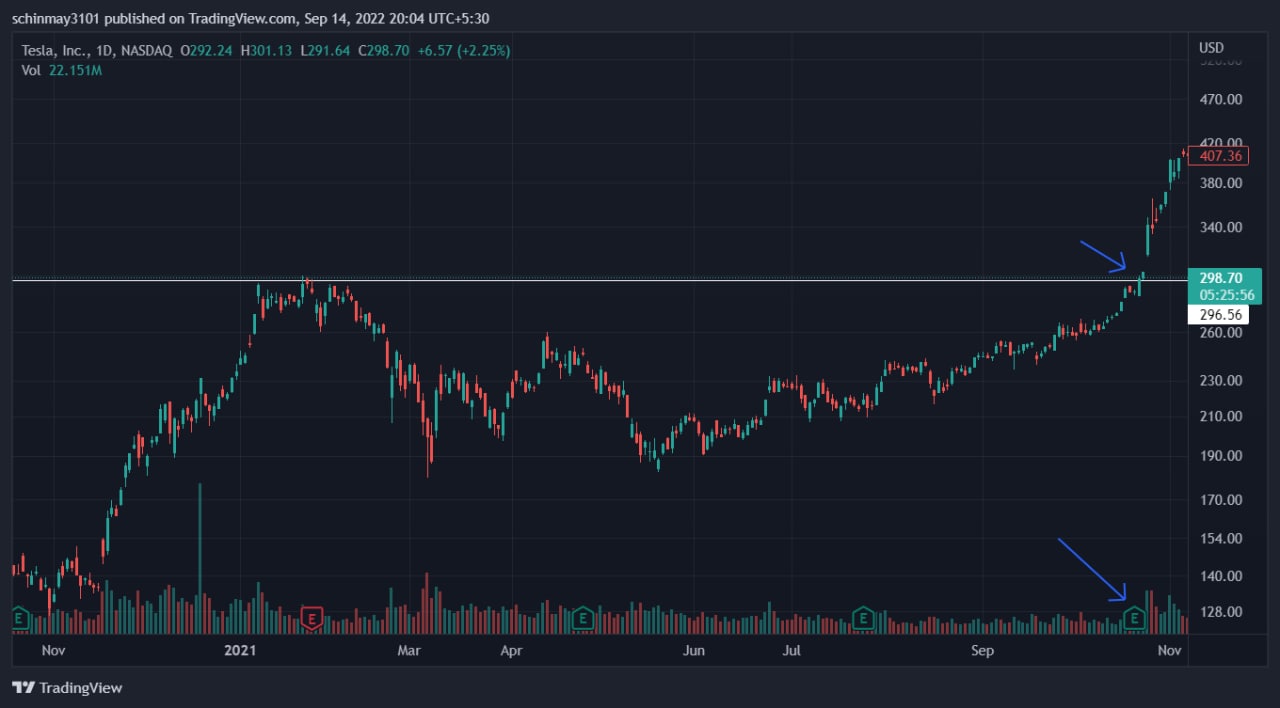
Example: On the chart of $TSLA, we see an increase in volumes at the moment when the price is approaching the resistance area. The indicator readings suggest that after breaking through the resistance level with high volumes the rally should continue, which is confirmed by the chart. After breaking through a significant resistance level, the stock quotes grew by almost 40%.
Also, if you want to use all available trading tools to increase your capital as soon as possible - follow this link below, or contact us via live chat. Our experts will help you to choose the best strategy for success.