
Swing Trading Indicator: 2. Moving Average (MA)
- George Solotarov
- Hits: 458

For effective swing trading, it is important to be able to identify long-term and short-term price trends. Moving Average (MA) is one of the most popular trend indicators. It smoothes price data and forms a constantly updated trend line based on historical prices. By changing the settings of the indicator and the timeframe of the price chart, you can track the dynamics of the selected asset's quotes for a certain period. The Expert Advisor clearly shows the general direction of the currency pair price movement and is also used to determine the support and resistance levels.
Signal type: Lagging; Entry/Exit
Base setup: The most commonly used MA strategy involves the use of two moving averages: the MA with a shorter period (usually 5 days) and the MA with a longer period (usually 25 days). A buy signal is generated when the MA with the shorter period crosses the MA with the longer period from below with a sell signal if it shrinks downwards.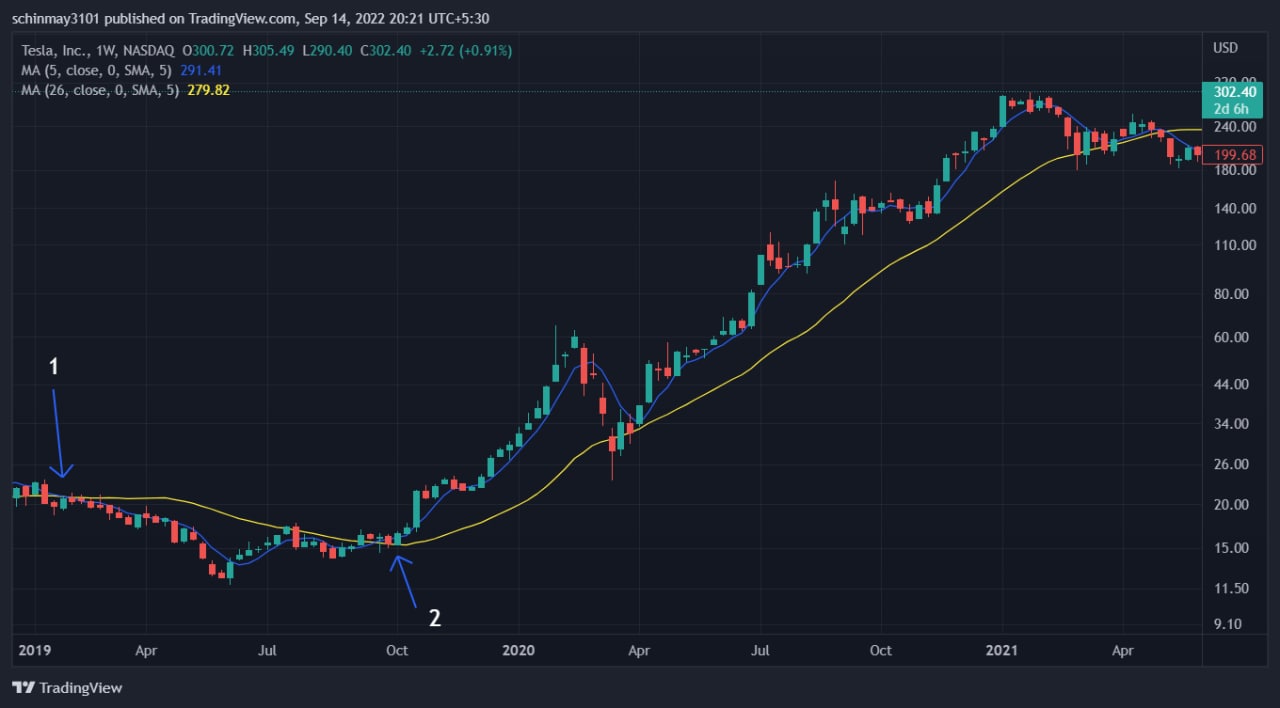
Example: The following chart for $TSLA shows a moving average with a shorter period (blue line) crossing below the moving average with a longer period (yellow line) at point 1, at which time the stock is moving down. This confirms a sell signal. Similarly, when the shorter-period MA (blue line) crosses the longer-period MA (yellow line) at 2, the stock is moving up. This confirms a buy signal.
Also, if you want to use all available trading tools to increase your capital as soon as possible - follow this link below, or contact us via live chat. Our experts will help you to choose the best strategy for success.