Algorithmic Trading: How to Test and Correctly Use Trading Advisors
- George Solotarov
- Hits: 341
Write comment (0 Comments)
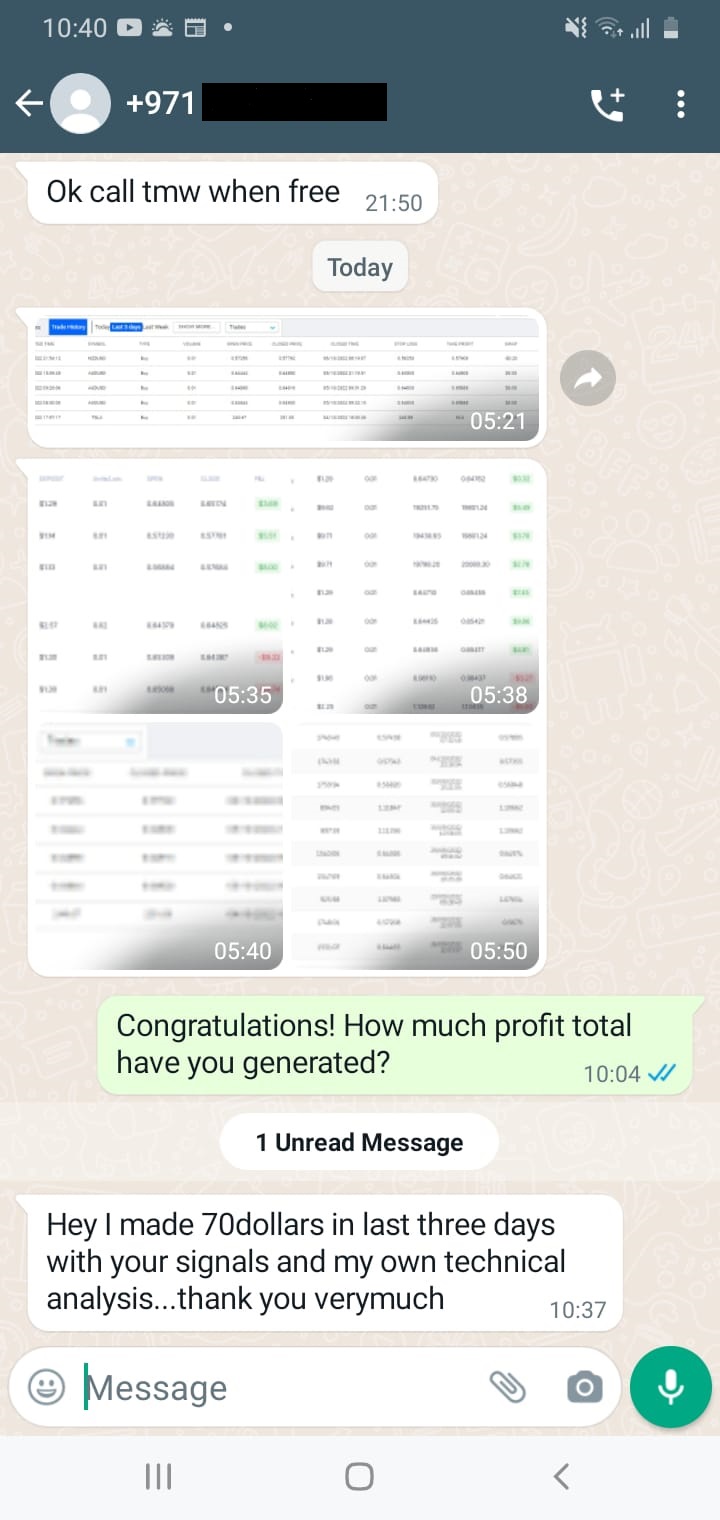
One of our members shared some impressive results about how he managed to multiply four times the original amount of deposit in his account. Thanks to a friend who advised him to use Tools Trades.
The income level of this member, who used Tools Trades signals and often consulted our support agents - literally in a matter of days began to multiply.
↑↑↑Our member's detailed feedback and excitement can be seen in the screenshot.↑↑↑
If you want to have the same experience of success - our team can help you. Our knowledge already makes more and more people happy and confident in their choice.
Also, if you want to use all available trading tools to increase your capital as soon as possible - follow this link below, or contact us via live chat. Our experts will help you to choose the best strategy for success.
Fibonacci levels. Price often lingers between intermediate Fibo levels during a correction - they can act as zones.
In this example, the Fibo levels on the downtrend showed a demand zone. The price retested the near level, failed to return to the far one, and then went upwards after the breakdown of the near level. According to the following Fibo levels, you could also draw local zones.
Pivot levels. A tool for determining possible reversal levels. Classic points show three resistance levels and three support levels, the significance of which increases as you move away from the current price value. The demand zone can be built between the 2nd (S2) and the 3rd (S3) support, and the supply zone - be between the 2nd (R2) and the 3rd (R3) resistance.
Early Pivot levels can also indicate anticipated zones, but it is better to be guided by current levels. The last level R2 shows the near (lower boundary) of a possible supply zone. It makes no sense to set the far border on R3, it is more logical to do it on the last short-term consolidation zone of the downtrend. Note: the constructed zone captured two good reversals on the left side of the chart. This confirms that the zone is strong enough and that a new temporary consolidation or reversal down here is possible.
Oscillators. They confirm a possible reversal. We can build zones based on the coinciding reversal of the price and the oscillator in the overbought/oversold ranges. Or you can receive a confirmation signal from the oscillator when the price will already be in its zones.
You can also use trend indicators to identify supply and demand zones, but they show better the moment of exiting these zones.
How to use zone patterns in trading:
___________
Also, if you want to use all available trading tools to increase your profits as soon as possible - follow this link below, or contact us via live chat. Our experts will help you to choose the best strategy for success.
Follow our updates for useful information in our series of articles.
Page 65 of 99